
Open to new roles and freelance projects
Copenhagen, Denmark
Peter Bekker
BI & Analytics Consultant Power BI & Data Modelling
I turn business data into models people trust and reports people actually use.
About
I'm based in Copenhagen and work as a BI & Analytics Consultant, building analytics solutions for clients, mostly in Power BI.
Most of my work is in the layer people don't see: well-structured semantic models, clear DAX and sensible data flows from sources like Snowflake. When that layer is right, the reports are fast and the numbers make sense.
I also care about the other end: helping clients tell a clear story with their data, so dashboards answer real business questions instead of just showing numbers.
Skills
Data & Analytics
Delivery & Advisory
Experience
-
Business Analytics Lead NTT DATA Business Solutions
Helped clients turn business requirements into Power BI solutions. Main stack: DAX, Power BI and Azure DevOps.
-
Senior Consultant Enversion A/S
Hired to help the Danish Health Data Authority (Sundhedsdatastyrelsen) build a Power BI dashboard, delivered as the public dual diagnosis report.
-
Business Intelligence Analyst Saxo
- Started as the organisation's only BI resource, providing end-to-end Qlik Sense support and advice across all departments.
- Analysed pricing strategies and customer behaviour, contributing to higher revenue and better margins.
- Identified key churn drivers and analysed marketing campaigns with Qlik Sense and Google Analytics.
-
Senior Digital Business Analyst YouSee
- Used Adobe Analytics to improve online self-service and reduce the number of customer calls.
- Built Power BI reports that supported better customer journeys and higher customer satisfaction.
-
Business Analyst Netdesign
Helped external clients implement and use Speech Analytics to find patterns in customer interactions and make support workflows more efficient.
-
Earlier roles
Senior Analyst at Telenor, Process Manager at TDC, Process Manager and Process Consultant at YouSee, and Process Consultant at IMPAC.
Education & certifications
-
MSc in Economics and Business Administration
-
Data Science & Big Data Analytics
-
PRINCE2 Practitioner
-
PRINCE2 Foundation
Projects
Integrated Dual Diagnosis Treatment
A public Power BI report on integrated treatment for people with both a mental illness and a substance use problem. I built it as a Senior Consultant at Enversion A/S, hired to help the Danish Health Data Authority (Sundhedsdatastyrelsen) create the dashboard, and it is published on eSundhed.dk.
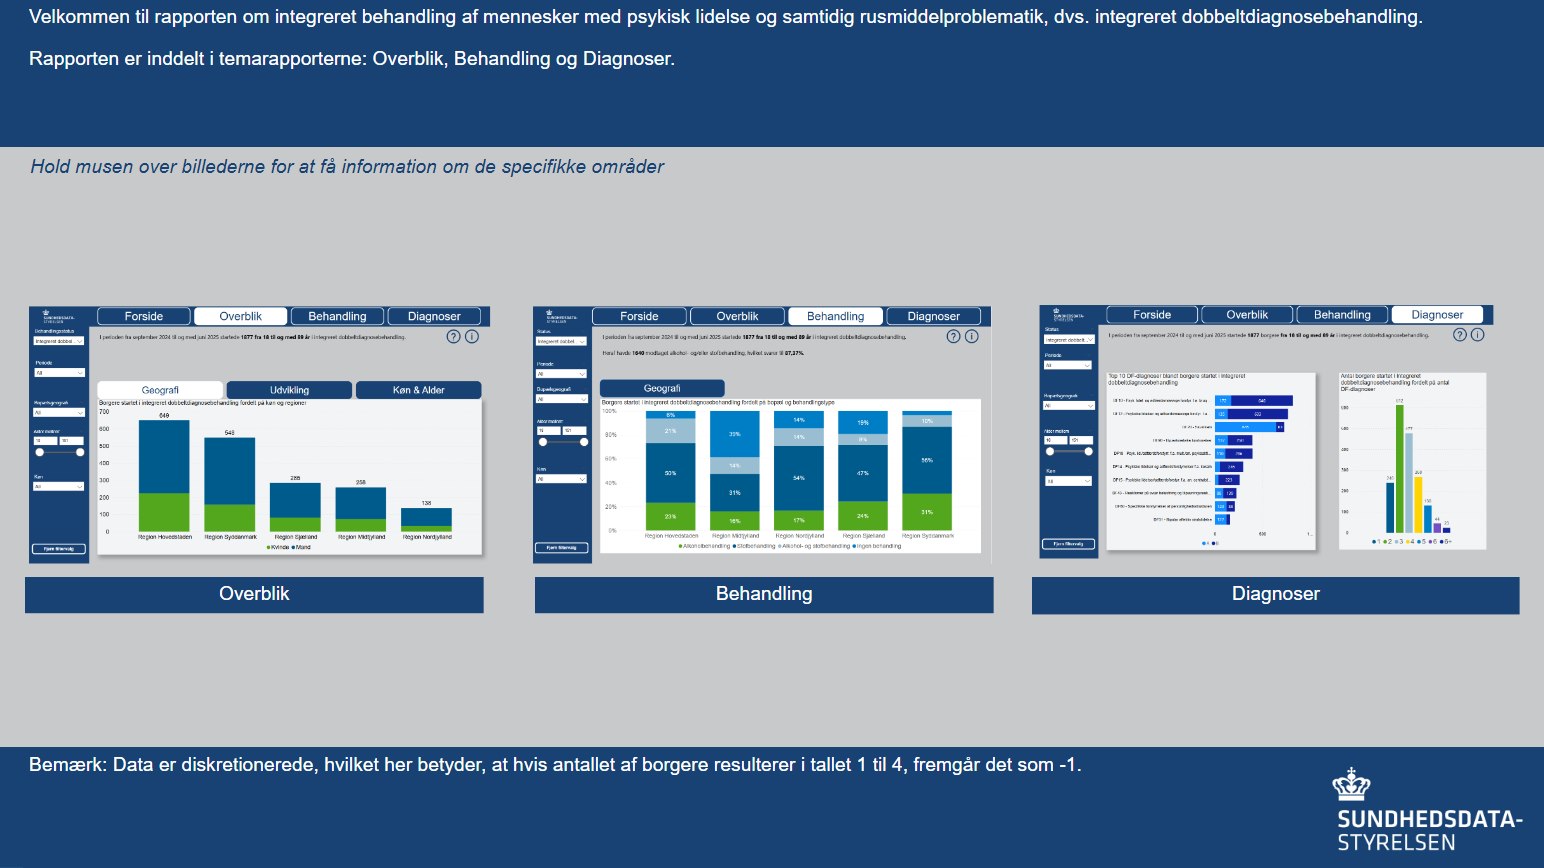
Report pages
Highlights
The report is in Danish and hosted by Sundhedsdatastyrelsen on eSundhed.dk.
The Nightmare Data Model
A Power BI model built from a messy 23-sheet Excel export covering sales, inventory, campaigns, order processing and targets.
- Challenge
- Related data was scattered across 23 sheets, with test records and duplicate products. A report on top of it could look right while its totals were inflated.
- Approach
- Split the data into six shared dimensions and six facts, each with a defined grain, and added a role that limits customer data by region.
- Result
- A model where every fact is filtered through the same dimensions, so totals can be checked and relationships are easy to follow.
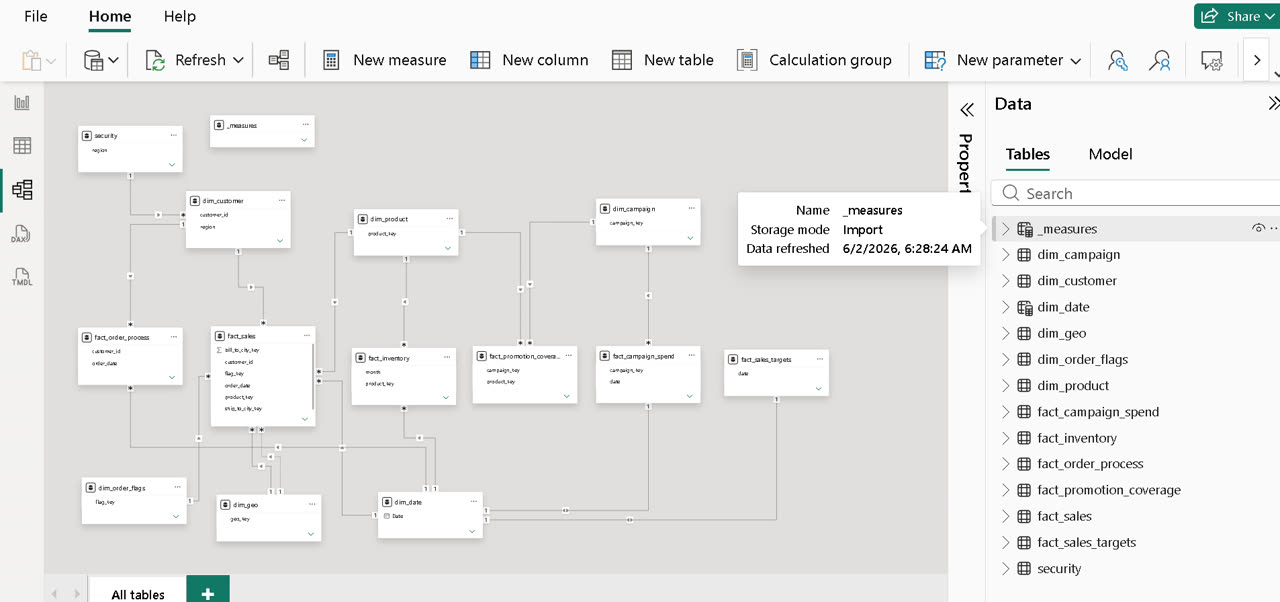
Open the PBIX in Power BI Desktop (opens in a new tab) (free, Windows). Dataset and scenario by Data with Baraa (opens in a new tab).
AdventureWorks Sales Report
An interactive Power BI report on sales for AdventureWorks, a fictional bike and outdoor-equipment company.
- Challenge
- Give managers a quick view of revenue, profit, orders and returns, and let them find what drives the numbers without asking an analyst.
- Approach
- A star schema with DAX measures for targets and month-on-month change, a what-if price parameter, field parameters and AI visuals.
- Result
- Readers go from headline KPIs to individual products, customers and regions, and can test how a price change affects profit.
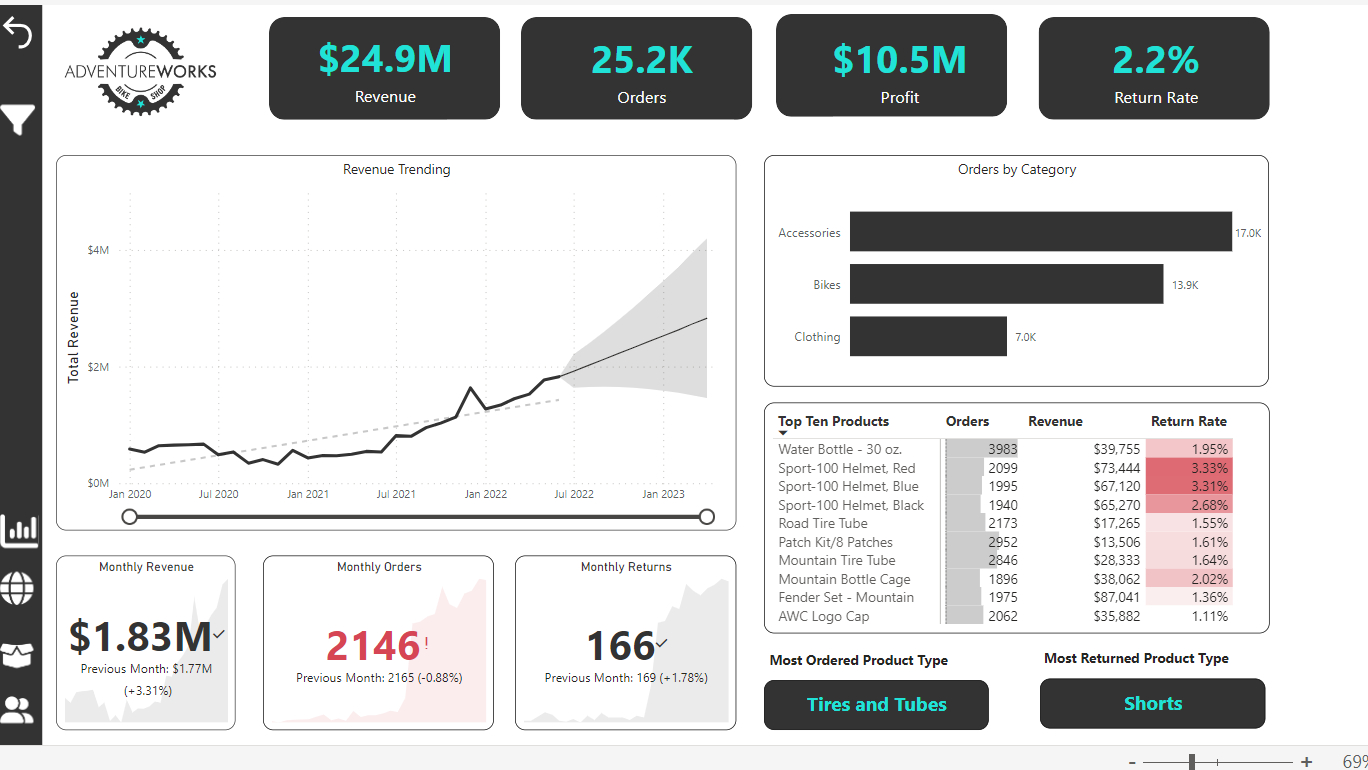
Report pages
Techniques
Open the PBIX in Power BI Desktop (opens in a new tab) (free, Windows). Built while following the Power BI course from Maven Analytics (opens in a new tab), using Microsoft's AdventureWorks sample data.
Data Runner
A browser game where you run through obstacles and can only get past them by answering multiple choice questions on SQL, Power BI data modelling and DAX.
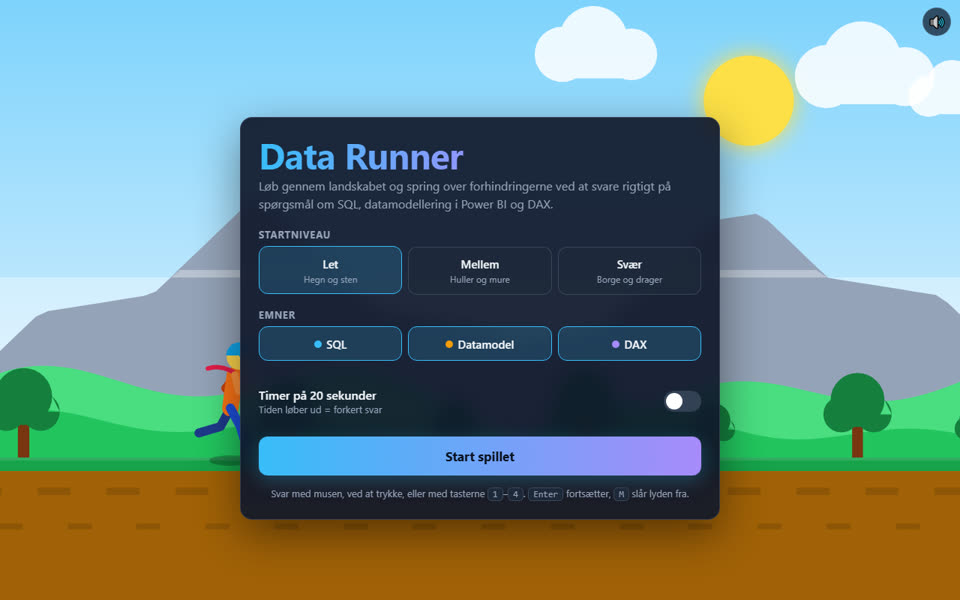
Loading game…
The game couldn't load here
Play Data Runner in its own tab instead. It works on desktop and mobile.
Play Data Runner (opens in a new tab)Trouble with the embed? Open the game directly (opens in a new tab).
Claude skills for Power BI
Six Claude skills I built for my own Power BI work. They are written in Danish and free to use under the MIT licence.
-
measure-analysis-power-bi (opens in a new tab)
Audits every DAX measure in a PBIP project, finds unused measures and anti-patterns, and writes a PDF report.
-
measure-excel-power-bi (opens in a new tab)
Exports all DAX measures to Excel with usage, dependencies, suggested rewrites and DAX Studio checks.
-
pbip-governance (opens in a new tab)
Documents a PBIP project: data lineage, possible PII columns, RLS and an Azure DevOps wiki.
-
data-modeling (opens in a new tab)
Builds a gold layer in Power Query and a finished PBIP model from a silver Excel file.
-
data-storytelling (opens in a new tab)
Guides dashboard design: visual choice per KPI, layout, drill-through and a pre-meeting QA checklist.
-
agent (opens in a new tab)
Runs the measure skills in sequence on a PBIP project and packs the results with a run log.
Video
From raw data to value
A 10-second video about data modelling in Power BI: the star schema, and the five steps to a strong model. Animated entirely in code with React and Remotion, with no video editor involved.
Contact
Let's talk data
Working on a Power BI model, a reporting setup or a data story that needs a clearer structure? Send me an e-mail, give me a call or reach out on LinkedIn.